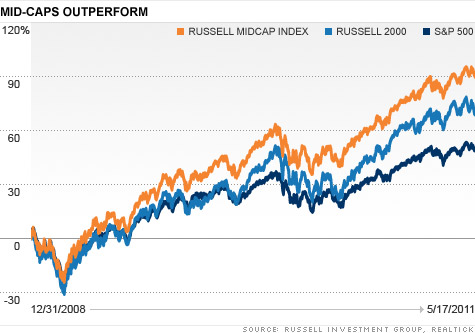
Click the chart to track the Russell Midcap Index.
NEW YORK (CNNMoney) -- It's easy for investors to get caught up in the debate about large versus small cap stocks, but if you really want to get an edge, experts say pay closer attention to shares of mid-sized companies.
Over the past 30 years, returns on midcaps stocks have pretty consistently topped those of their bigger and smaller counterparts.
And this year is no different. The Russell Midcap Index, which tracks companies with a market value between $1 billion and $14 billion, is up more than 8% in 2011.
That beats the 5% gains in the Russell 2000 and the S&P 500 index, which measure the performance of the small-cap and large-cap segments of the U.S. stock market respectively.
"In the past, investment advice has called for investors to barbell their portfolio [with] the idea that if you invest in large caps and small caps, you cover the waterfront," said Michelle Clayman, portfolio manager of the Calvert Capital Accumulation Fund (CCAFX). "That strategy leaves midcaps under-owned so investors have a pretty fertile fishing ground."
Midcaps represent about 27% of the market, but only 15% of mutual fund assets invested in U.S. funds are classified as midcaps, according to Morningstar data.
"Midcaps are in fact the market's sweet spot because their risk-reward trade-off is more favorable than any other part of the market," said Don Cleven, portfolio manager of the Touchstone Midcap Value Fund (TCVAX).
Similar to upstarts, mid-sized companies can easily double or triple their annual earnings and returns since they are still in the growth phase of their life cycles.
At the same time, midcaps are less volatile than smaller, speculative names since they come with proven business models and management teams similar to corporate giants.
Those merits are why midcaps proved to be so resilient through the post-recession churning. It's also what helps safeguard them during rough economic cycles, when less established companies are more likely to fail.
Midcaps also make ideal takeover targets, said Don Easley, portfolio manager of the T. Rowe Price Diversified Mid-cap Growth Fund (PRDMX).
For example, just last month, $41 billion Texas Instruments (TXN, Fortune 500) acquired National Semiconductor (NSM) for $6.5 billion. Shares of National Semi jumped more than 70% after the deal was announced.
"It's much more palatable to buy something with a $2 billion to $5 billion value than a $50 billion valuation," Easley said.
Though midcaps remain favorable for the long-term, Easley cautioned that near-term returns may slow down a bit as investors go after relatively less expensive large-cap stocks.
"Midcaps have had a long, impressive run, so I wouldn't be surprised to see a shift into large cap stocks, which have been underperforming," he said. "But midcaps still aren't egregiously valued and the attractiveness of rapidly-growing, stable companies will never go away." ![]()
| Index | Last | Change | % Change |
|---|---|---|---|
| Dow | 32,627.97 | -234.33 | -0.71% |
| Nasdaq | 13,215.24 | 99.07 | 0.76% |
| S&P 500 | 3,913.10 | -2.36 | -0.06% |
| Treasuries | 1.73 | 0.00 | 0.12% |
| Company | Price | Change | % Change |
|---|---|---|---|
| Ford Motor Co | 8.29 | 0.05 | 0.61% |
| Advanced Micro Devic... | 54.59 | 0.70 | 1.30% |
| Cisco Systems Inc | 47.49 | -2.44 | -4.89% |
| General Electric Co | 13.00 | -0.16 | -1.22% |
| Kraft Heinz Co | 27.84 | -2.20 | -7.32% |
| Overnight Avg Rate | Latest | Change | Last Week |
|---|---|---|---|
| 30 yr fixed | 3.80% | 3.88% | |
| 15 yr fixed | 3.20% | 3.23% | |
| 5/1 ARM | 3.84% | 3.88% | |
| 30 yr refi | 3.82% | 3.93% | |
| 15 yr refi | 3.20% | 3.23% |
Today's featured rates:

