13 of 100
BACKNEXT
13. lululemon athletica
3-year average
Revenue Growth: 34%
Profit Growth: 47%
Total Return: 57%
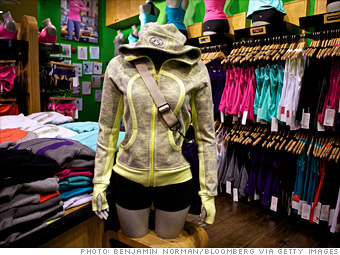
Selling yoga pants at $98 a pop, workout gear retailer Lululemon might not seem like a good bet in tough times. But its high-quality products have hooked the fashion-conscious and the fit-a crowd that still has discretionary income. Since 2004 the brand has increased revenue at a compound annual rate of 61%. It now operates some 140 stores with for as many as 27 more in 2011. Last year, the stores averaged $1,726 in sales per square foot, among the best in the industry.

It's unclear if the company can sustain its breakneck growth pace, in part because its success is drawing competitors such as the Gap's Athleta stores. But so far Lululemon shows few signs of slowing. In the works: plans to expand its men's business, broaden its offerings possibly to include bags and coats, boost international sales, and, of course, keep pursuing the Lululemon target: the woman who "pursues exercise to achieve physical fitness and inner peace."
Get stock quote: LULU
Revenue ($ millions): $760.2
Net Income ($ millions): $135.6
Industry: Retail
Network with lululemon athletica
What businesses do you think are primed to grow in this economy?
From the September 26, 2011 issue.
Revenue and profit figures reflect the four quarters ended on or before April 30,2011.
Total return is through June 30, 2011.

Sturm Ruger & Co 848%
Cirrus Logic 340%
Hi-Tech Pharmacal 234%
Green Mountain Coffee Roasters 120%
Netflix 116%
Acme Packet 108%
To qualify, a company -- domestic or foreign -- must be trading on a major U.S. stock exchange; file quarterly reports to the SEC; have a minimum market... More
Current Issue
  • Give the gift of Fortune
  • Get the Fortune app
  • Subscribe

Most stock quote data provided by BATS. Market indices are shown in real time, except for the DJIA, which is delayed by two minutes. All times are ET. Disclaimer. Morningstar: © 2018 Morningstar, Inc. All Rights Reserved. Factset: FactSet Research Systems Inc. 2018. All rights reserved. Chicago Mercantile Association: Certain market data is the property of Chicago Mercantile Exchange Inc. and its licensors. All rights reserved. Dow Jones: The Dow Jones branded indices are proprietary to and are calculated, distributed and marketed by DJI Opco, a subsidiary of S&P Dow Jones Indices LLC and have been licensed for use to S&P Opco, LLC and CNN. Standard & Poor's and S&P are registered trademarks of Standard & Poor's Financial Services LLC and Dow Jones is a registered trademark of Dow Jones Trademark Holdings LLC. All content of the Dow Jones branded indices © S&P Dow Jones Indices LLC 2018 and/or its affiliates.