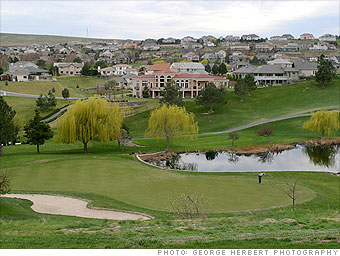
BACK NEXT
3. Kennewick, WA
Kennewick
Home price forecast (1 year):* 4.6%
This small metro area may share the same state with Seattle and Tacoma but it's an entirely different world on the eastern side of the Cascades. Kennewick is in the rain shadow of the mountains and geographically has more in common with dry, southwestern Idaho than the rainy Washington coast.

Employment has remained strong here. Median income is more than $61,000 while home prices, a median of $172,000, and other expenses remain low. The cost of living is about 27% lower than Seattle. That should keep housing markets on their steady uphill climb.
Is this a good time to buy a home in Kennewick?
Population:
(2006)
226,033
Median family income:
(2008)
$61,200
Median home price:
(2009)
$172,000
Affordability index:
(Median home price/family income 2009)
2.8
Prices peaked in:
Total climb during the boom:
(2000 to peak)
N/A
Total decline so far:
(Peak through 2009)
One-year change:
(Q4 2008 to Q4 2009)
2.4%
Additional price change to bottom: N/A
When they'll hit bottom:
*(Q1 2010 - Q1 2011)
† Data is for Kennewick-Pasco-Richland, WA Metropolitan Statistical Area
Notes:
Median home prices are for single-family homes through the third quarter of 2009, the most recent data available, and include sales of bank-owned properties.
Sources: Fiserv and Moody's Economy.com
Click map to enlarge
Show: Homes for sale | Top 25 drops | Top 25 gains
More places in Washington
  • Find Homes for sale
    Real estate and homes for sale on Trulia

  • Property Type
  • Find a home in:
  • New York | Atlanta | Chicago | Los Angeles
  • Washington D.C | Houston | Philadelphia | More options

Most stock quote data provided by BATS. Market indices are shown in real time, except for the DJIA, which is delayed by two minutes. All times are ET. Disclaimer. Morningstar: © 2018 Morningstar, Inc. All Rights Reserved. Factset: FactSet Research Systems Inc. 2018. All rights reserved. Chicago Mercantile Association: Certain market data is the property of Chicago Mercantile Exchange Inc. and its licensors. All rights reserved. Dow Jones: The Dow Jones branded indices are proprietary to and are calculated, distributed and marketed by DJI Opco, a subsidiary of S&P Dow Jones Indices LLC and have been licensed for use to S&P Opco, LLC and CNN. Standard & Poor's and S&P are registered trademarks of Standard & Poor's Financial Services LLC and Dow Jones is a registered trademark of Dow Jones Trademark Holdings LLC. All content of the Dow Jones branded indices © S&P Dow Jones Indices LLC 2018 and/or its affiliates.