BACK NEXT
2. Cheyenne, WY
Cheyenne
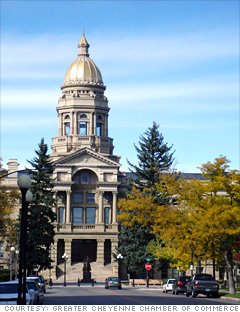
Home price forecast (1 year):* 4.7%
The city has attracted some new employers in recent years, giving the local economy a boost. Cheyenne's job market is also tied to the city's status as state capital, which has kept area unemployment below the national rate.

Cheyenne was one of the few metro areas that recorded home price gains in the past three years, and population growth should help drive up home prices further. The number of city residents jumped by double digits during the 2000s and will probably do so again in the coming decade. That will provide a steady demand for housing, and prices are projected to grow by about 5.5% through 2012.
Is this a good time to buy a home in Cheyenne?
Population:
(2006)
85,384
Median family income:
(2008)
$62,600
Median home price:
(2009)
N/A
Affordability index:
(Median home price/family income 2009)
N/A
Prices peaked in: 2009:Q1
Total climb during the boom:
(2000 to peak)
61.3%
Total decline so far:
(Peak through 2009)
-2.4%
One-year change:
(Q4 2008 to Q4 2009)
-0.5%
Additional price change to bottom: 0.2%
When they'll hit bottom: 2010:Q1
*(Q1 2010 - Q1 2011)
† Data is for Cheyenne, WY Metropolitan Statistical Area
Notes:
Median home prices are for single-family homes through the third quarter of 2009, the most recent data available, and include sales of bank-owned properties.
Sources: Fiserv and Moody's Economy.com
Click map to enlarge
Show: Homes for sale | Top 25 drops | Top 25 gains
More places in Wyoming
  • Find Homes for sale
    Real estate and homes for sale on Trulia

  • Property Type
  • Find a home in:
  • New York | Atlanta | Chicago | Los Angeles
  • Washington D.C | Houston | Philadelphia | More options

Most stock quote data provided by BATS. Market indices are shown in real time, except for the DJIA, which is delayed by two minutes. All times are ET. Disclaimer. Morningstar: © 2018 Morningstar, Inc. All Rights Reserved. Factset: FactSet Research Systems Inc. 2018. All rights reserved. Chicago Mercantile Association: Certain market data is the property of Chicago Mercantile Exchange Inc. and its licensors. All rights reserved. Dow Jones: The Dow Jones branded indices are proprietary to and are calculated, distributed and marketed by DJI Opco, a subsidiary of S&P Dow Jones Indices LLC and have been licensed for use to S&P Opco, LLC and CNN. Standard & Poor's and S&P are registered trademarks of Standard & Poor's Financial Services LLC and Dow Jones is a registered trademark of Dow Jones Trademark Holdings LLC. All content of the Dow Jones branded indices © S&P Dow Jones Indices LLC 2018 and/or its affiliates.